Features
Unlimited invocations
Even on our free tier! 🎉
Cost effective
It’s self hosted, so you have control of your budget.
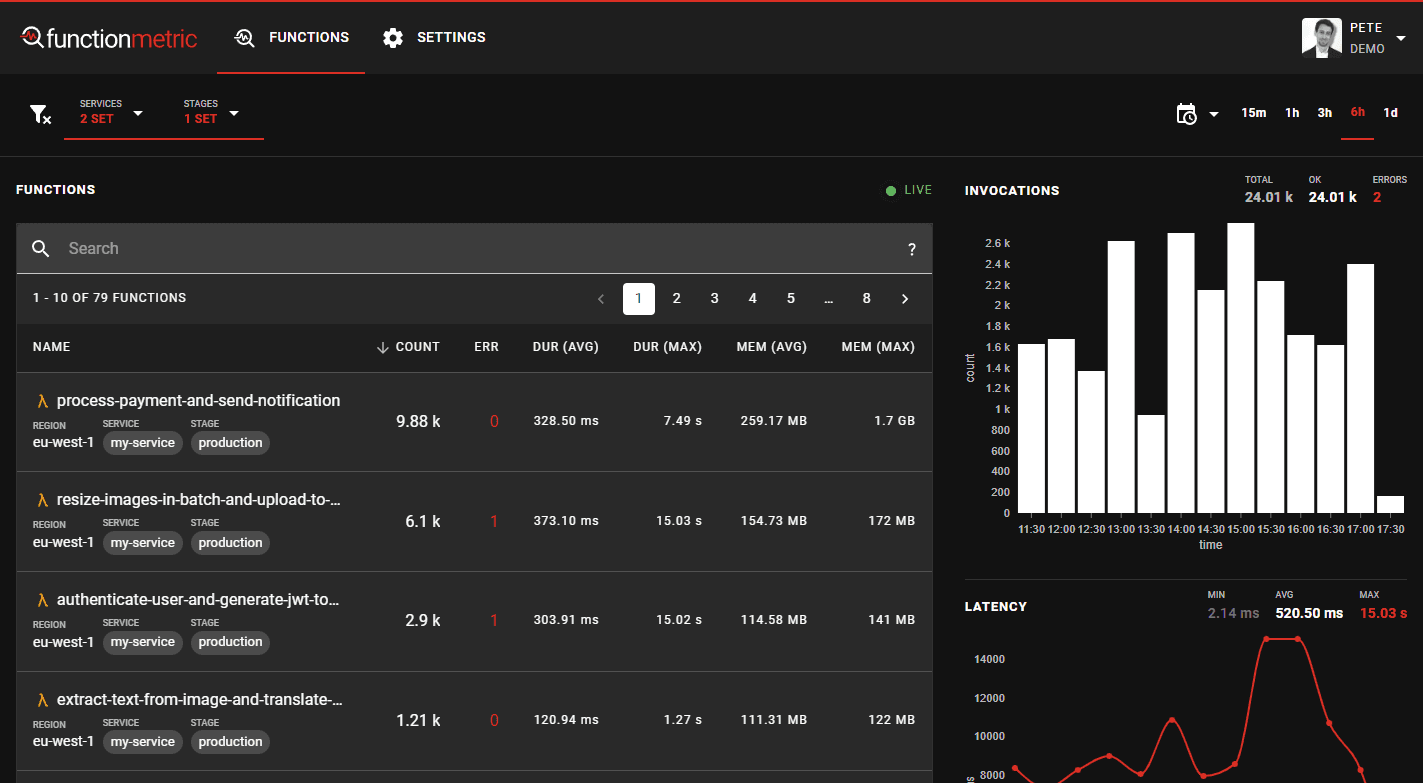
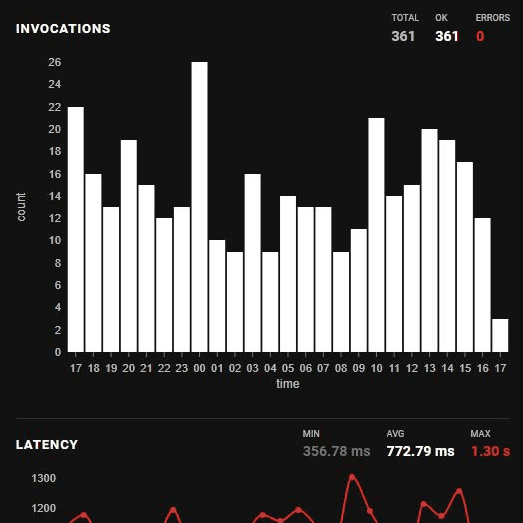
Real-time metrics
View function invocations, metrics and logs in real time.
Single dashboard
Consolidate multiple accounts and services into a single filterable dashboard.
Configurable retention
Choose your own retention periods for metrics
Optimised for mobile
Investigate issues on any device, even on your mobile while in the pub!
How it works
Create your account
Create or log in to your functionmetric account.
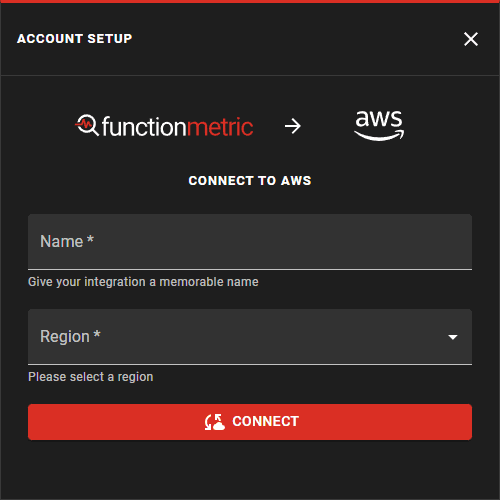
Deploy the CloudFormation template
Simply deploy our CloudFormation template to your AWS account. We’ll detect your functions automatically.
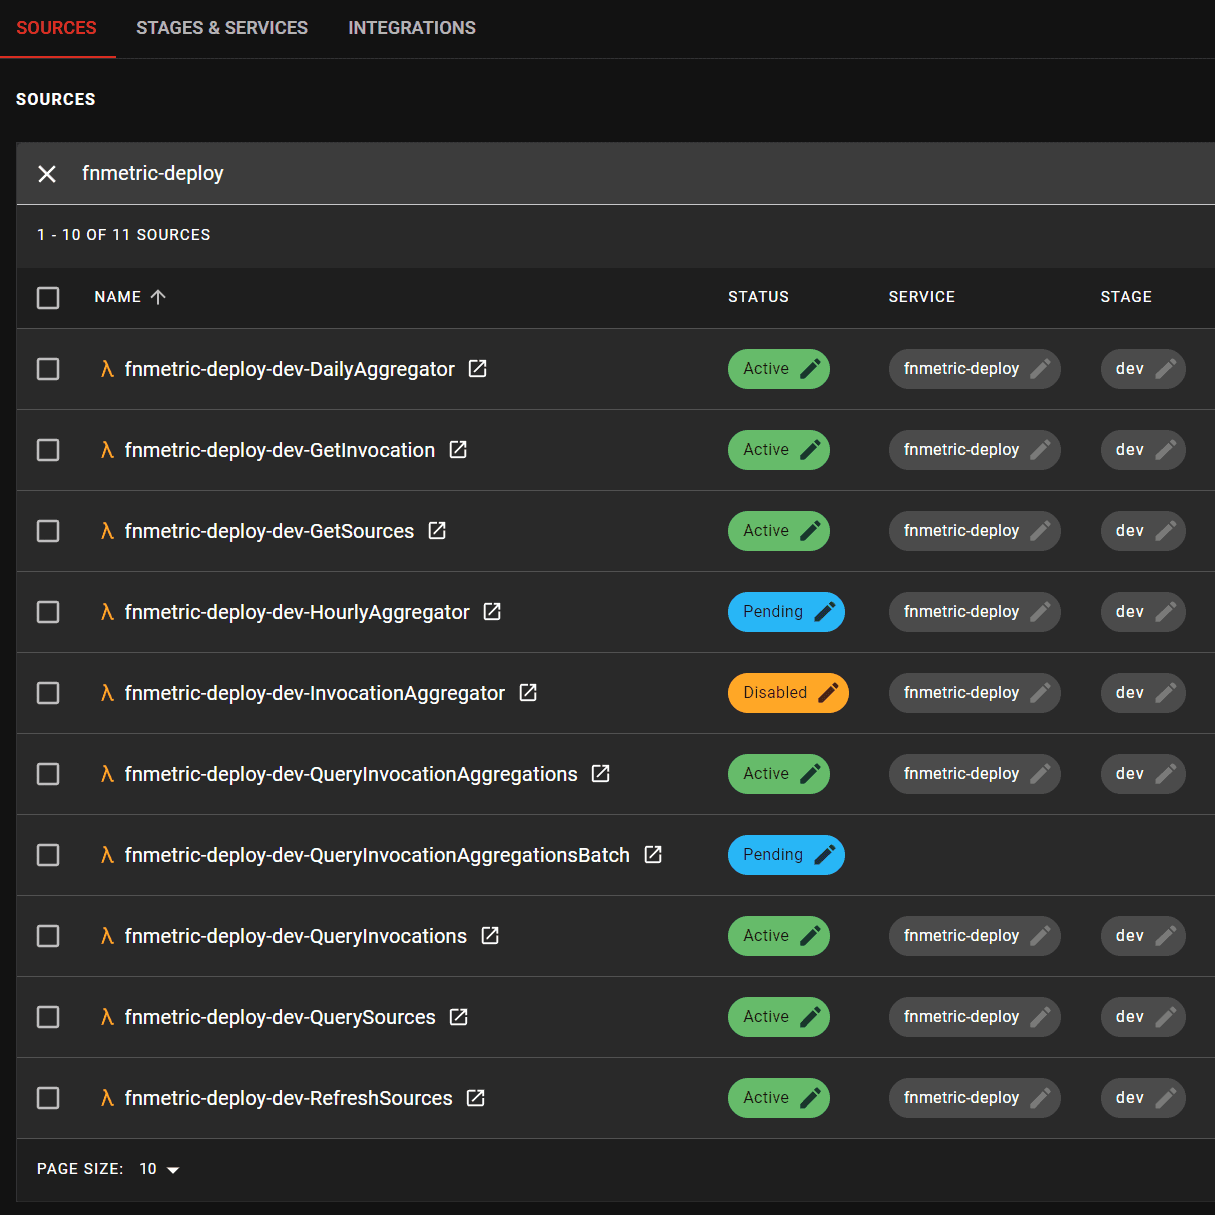
Choose which functions to monitor
Categorise your functions into apps and stages.
That’s it. 🎉
You’re now collecting invocation and metric data!
CLOUDFORMATION Deployment
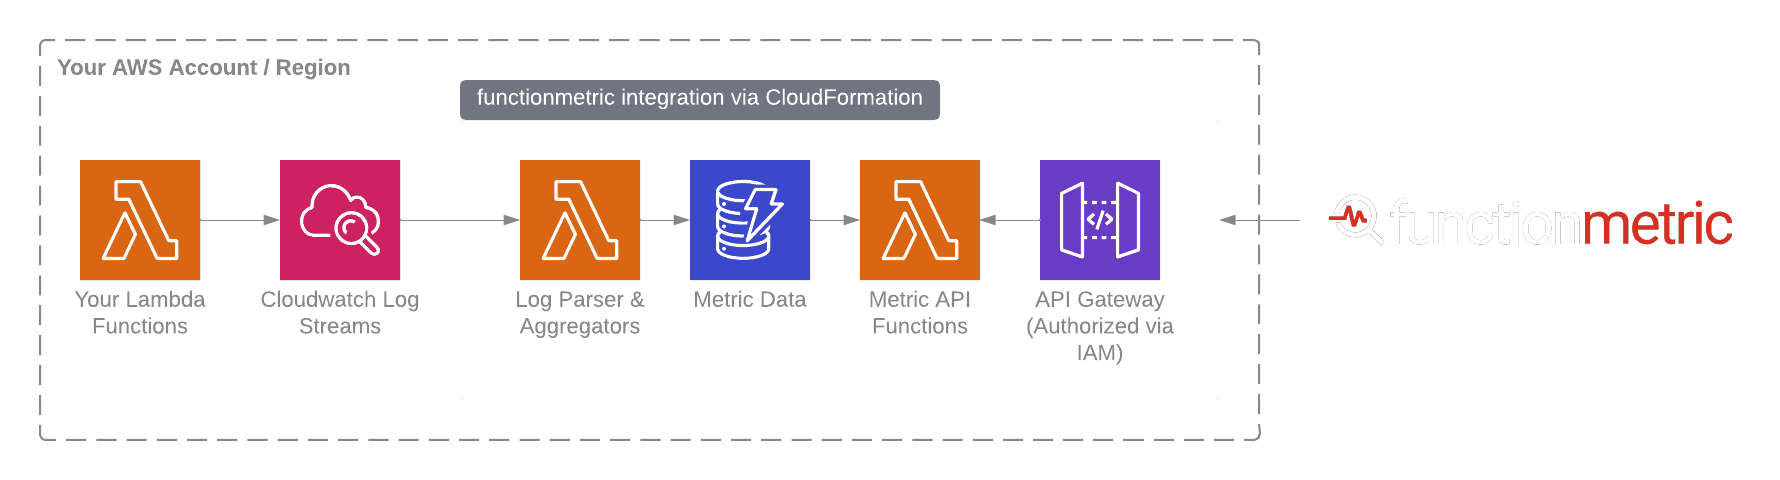
Self hosted
All metric data and analysis remains within your own AWS account.
Secured by IAM roles
All APIs are secured using AWS_IAM roles to ensure that the public footprint is protected.
Serverless approach
So you only pay for the monitoring you need.
Supported Services
AWS LAMBDA
FAQs
What types of lambda functions does functionmetric support?
During the beta, we currently have support for nodeJS, Python and Java lambda functions. Additional support will be added as we develop the platform.
What AWS regions are supported by functionmetric?
The following regions are currently supported:
- eu-west-1
- eu-west-2
- eu-west-3
- eu-central-1
- eu-north-1
- us-east-1
- us-east-2
- us-west-1
- us-west-2
- ca-central-1
- sa-east-1
- ap-south-1
- ap-northeast-3
- ap-northeast-2
- ap-southeast-1
- ap-southeast-2
- ap-northeast-1
Is functionmetric easy to set up, and what kind of technical expertise do I need?
You will need to be able to set up our CloudFormation template in your AWS account. Head to our documentation which will walk you through the setup process.
How does functionmetric differ from other serverless monitoring tools on the market?
Unlike other monitoring tools, the majority of functionmetric is self-hosted. We don't limit or charge based on the number of invocations you want to collect metrics for.
How frequently does functionmetric collect and display data on my serverless functions?
Data is collected directly from your Cloudwatch logs in real time, metrics are usually updated on the dashboard within about 10 seconds.
Can I customize the metrics that functionmetric collects and monitors?
You can select the specific functions that you want to monitor in your account, and categorise them into services and stages in order to filter your dashboard. The same set of metrics is collected for every tracked function.
How do I access the data and metrics collected by functionmetric?
Your metric data stays stored in your own AWS account. To easily view and visualise this data, log in to your account on functionmetric.com
Can functionmetric help me troubleshoot issues with my serverless functions?
Yes, currently you can see an overview of invocation and error counts, execution time, memory usage, and look at individual invocations and their log data. We plan to add additional features to make it even easier to see potential problems with your functions in future.
How does functionmetric ensure the security and privacy of my data?
In regards to your personal and account information, see our Privacy Policy. Metrics collected about your functions stay stored in your own account, and we never generate any public credentials, so you stay chiefly responsible for their security.
What kind of customer support is available for functionmetric users?
Head to our Discord server for support from us and the functionmetric community! Alternatively, email us directly at support@functionmetric.com
Does functionmetric support alerting and notifications?
These are the very next items on our roadmap :)